Microsoft Intune is a cloud-based service that provides mobile device management, mobile application management, and PC management capabilities. One of the key features of Intune is its ability to capture health related information for client machines.
However, lots of admins struggle to capture event IDs from client machines connected to internet.
Let’s try to make a custom solution using following items in a flow.
- PowerShell Script
- Endpoint Remediation in Intune
- Log Analytics workspace.
Let’s understand each of them one by one.
PowerShell script: obviously most of IT administrators are aware of this. However, for those who rarely use, PowerShell is a task automation and configuration management framework developed by Microsoft, consisting of a command-line shell and associated scripting language. PowerShell scripts can be used to automate various tasks, such as managing system configurations, performing administrative tasks, and retrieving information from remote systems. In our case, we will try to fetch security event ID 4624 from a remote machine connected to internet and enrolled in Intune.
Proactive remediation is a feature that allows administrators to detect and fix common issues on devices enrolled in Microsoft Endpoint Manager. It uses custom scripts to detect and remediate issues on devices. These scripts can be created by administrators or imported from the Microsoft Endpoint Manager community.
In our case, we are going to use Administrator created script.
Let’s try to create a simple script. All we need to do is:
- Create Log analytics workspace
- Create PowerShell script using module named “OMSIngestionAPI”.
- PowerShell Command to fetch Event Logs from machine.
- Upload Event Log information to Log analytics.
Now, let’s create a Log Analytics Workspace.
To create a Log Analytics workspace, you can follow these steps:
- Sign in to the Azure portal.
- Click on “Create a resource” in the left navigation pane.
- Search for “Log Analytics” and select “Log Analytics” from the results.
- Click on the “Create” button.
- Select the subscription you want to use, and then create a new resource group or select an existing one.
- Enter a name for the workspace, select a region, and then click on the “Review + Create” button.
- Review the settings and click on the “Create” button to create the workspace.
Once the workspace is created, you can start sending data to it from various sources, such as Azure virtual machines, Azure Monitor, and other Azure services.
Once done, lets get the workspace ID and Primary Key of that log analytics workspace.
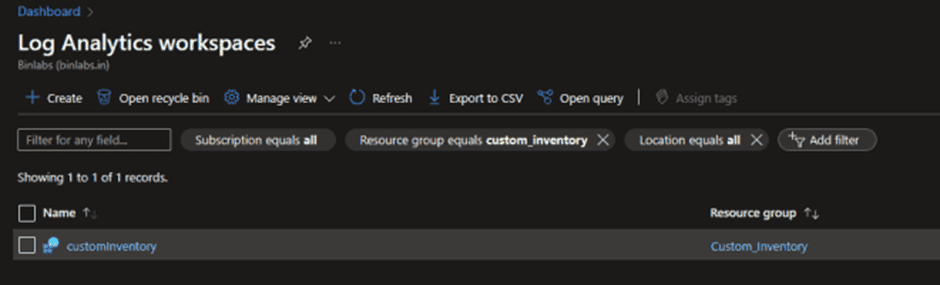
To obtain the Workspace ID and Primary Key for a Log Analytics workspace, you can follow these steps:
- Sign in to the Azure portal.
- In the left navigation pane, click on “All services” and search for “Log Analytics workspaces”.
- Click on the name of the workspace you want to get the ID and key for.
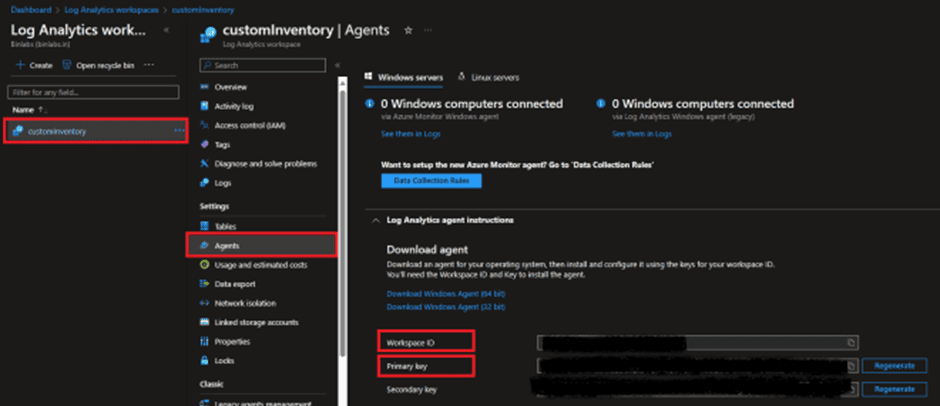
- In the workspace’s left navigation pane, click on “Agents management” under the “Settings” section.
- The Workspace ID is displayed on the “Agents management” page, and you can click on the “Primary Key” button to reveal the Primary Key.
Once Obtained, replace the workspace ID and Primary Key in script mentioned above.
Its time to deploy the script using Proactive remediation. Use following script to deploy.
#Please try this script AS-IS after testing in lab.

# Replace with your Workspace ID

$CustomerId = " "


# Replace with your Primary Key

$SharedKey = " "

#Be aware that the keys will be downloaded by client machines in Plain text.
#If you want to avoid sending keys to client machines, authentication method can be replaced with a Service Principle Account. There are other ways to complete the authentication as well which I will demonstrate in future blog post.


If((Get-Module -Name OMSIngestionAPI) -eq $null)

{


    Install-packageProvider -name NuGet -MinimumVersion 2.8.5.201 -Force

    Install-Module -Name OMSIngestionAPI -Force

    Import-Module -Name OMSIngestionAPI -Force

}


$EventLogs = Get-EventLog -LogName Security -InstanceId 4624


# Specify the name of the record type that you'll be creating

$LogType = "Event_Logs"


# Specify a field with the created time for the records

$TimeStampField = get-date

$TimeStampField = $TimeStampField.GetDateTimeFormats(115)


$EventLogsData =@()


foreach ($evnt in $EventLogs)

{

 $property = @{

        ComputerName    = "$($env:COMPUTERNAME)"

        EventID           = "$($evnt.EventID)"

        Category      = "$($evnt.CategoryNumber)"

        EntryType= "$($evnt.EntryType)"

        Message="$($evnt.Message)"

        Source    ="$($evnt.Source)"

        ReplacementStrings=$($evnt.ReplacementStrings)

   }


  $obj=new-Object -TypeName PSObject $property

  $EventLogsData += $obj

}


$EventLogsDataJSON = $EventLogsData | ConvertTo-Json -Depth 10

Send-OMSAPIIngestionFile -customerId $customerId -sharedKey $SharedKey -body $EventLogsDataJSON -logType $LogType -TimeStampField $TimeStampField
Here are the steps to deploy a script using proactive remediation in Intune:
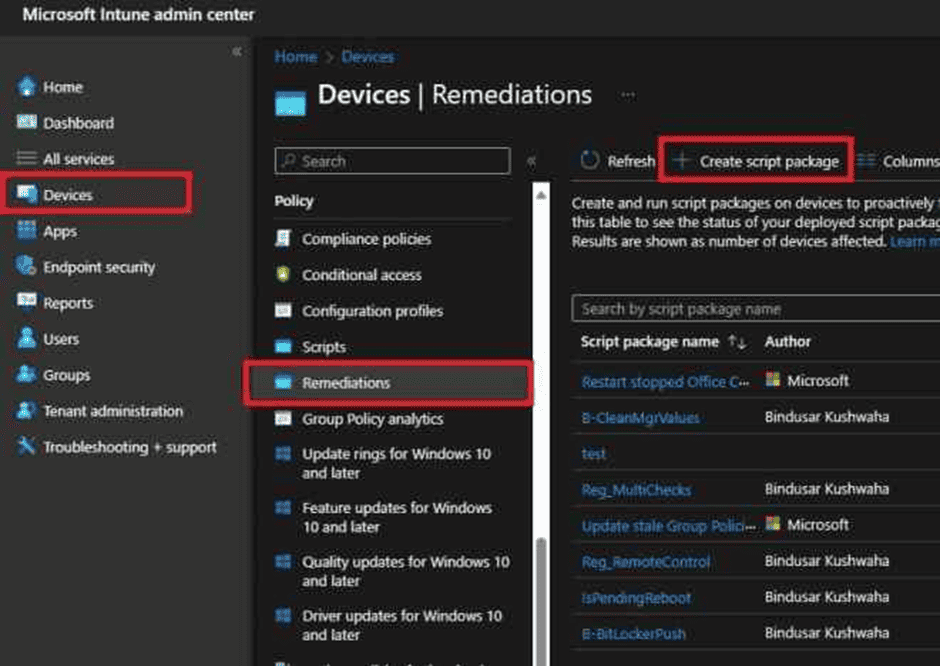
- In the Microsoft Endpoint Manager admin Center, select Reports > Endpoint analytics > Proactive remediations. Or with new option, its available in Intune Portal Directly as shown above.
- Select Create script package.
- On the Basics page, enter a name and description for the script package, and then select Next.
- On the Detection script page, select the script type, and then enter or upload the detection script. This script should return an exit code of 0 if the issue is not detected. Since we are running detection script to perform some action every time script is running without relying on detection and remediation concept, we will not be using remediation script. Select Next.
- On the Remediation script page, select Next as we are not doing anything here.
- On the Scope tags page, you can optionally assign scope tags to the script package, and then select Next.
- On the Assignments page, select the groups to which you want to assign the script package, and then select Next.
- On the Review + create page, review the settings, and then select Create.
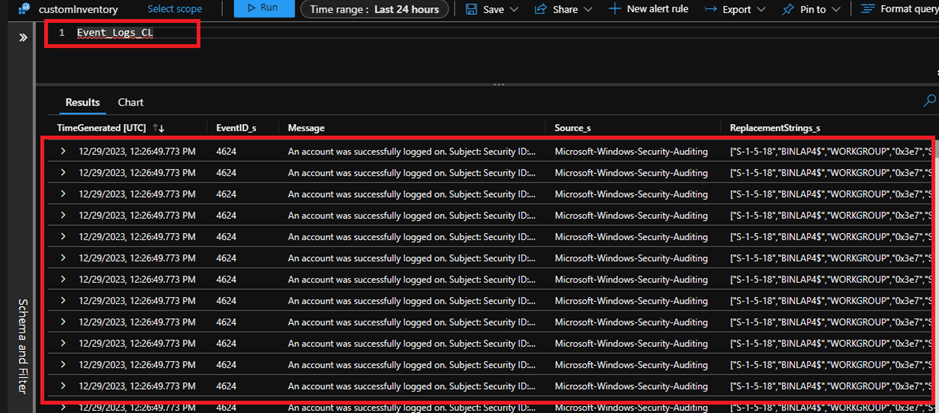
After the script package is created, it will be deployed to the devices in the assigned groups. The detection script will run on the devices.
Once the script reach to client machines, they should start sending data to log analytics. Below is how it should look like.
I hope this article has been helpful to you in learning how to use the Proactive Remediations feature of Endpoint Analytics. This is a powerful tool that can help you automate and streamline your device management tasks, improve your security posture, and enhance your user experience.
Thank you for spending time to read this article. I wish you all the best in your journey to optimize your endpoints. Stay tuned for more articles on Endpoint Analytics, Intune, PowerShell Scripting, Log Analytics and other Microsoft 365 topics.


Leave a comment